Isotopic δ¹³C LabForensic lab

Reproducing the Suess-effect papers from the data out

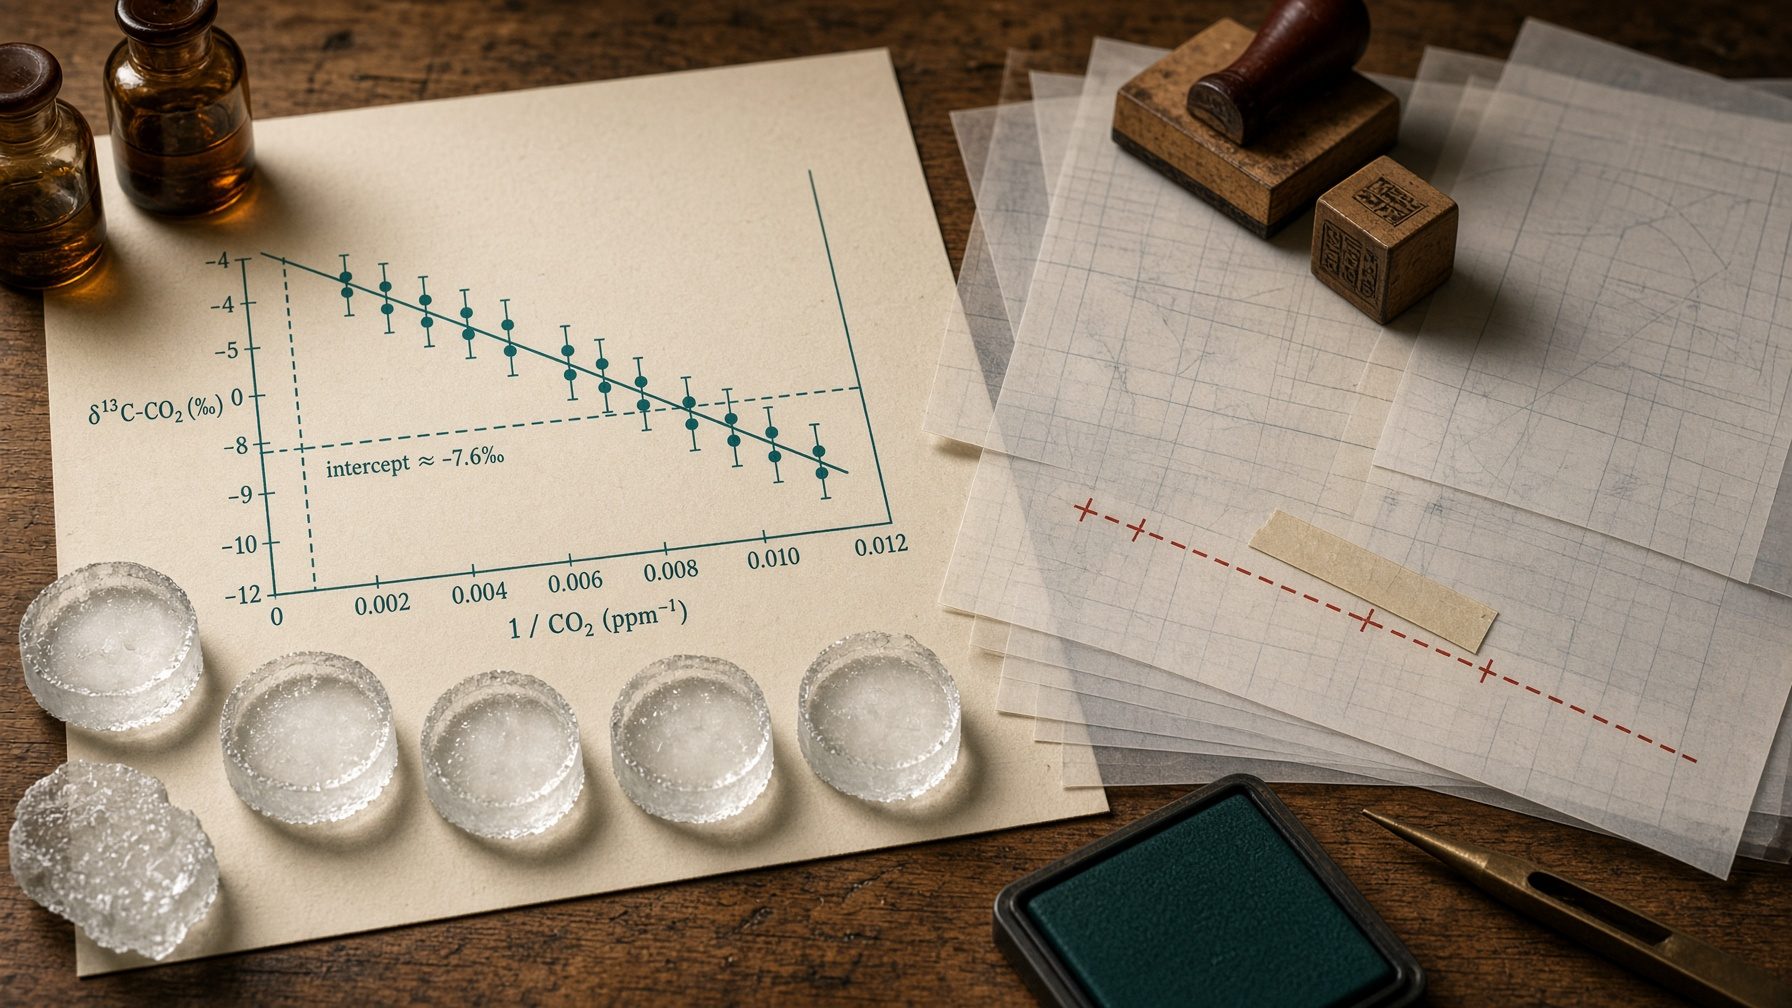
The isotopic signature was assembled, not observed.

Francey et al. (1999) and the CSIRO GASLAB flask programme (Allison et al., Cape Grim, CG92) are cited as the fossil-fuel fingerprint in air: falling δ¹³C. Rebuild their record, strip the documented corrections, and the mixing intercept stays near −13‰ — not the −28‰ of coal, oil and gas. The fossil number is a model isoflux, not a measurement.

Observed intercept δI

−13.3‰

Keeling plot, four stations

Fossil-fuel claim

−28‰

Andres / IPCC mix

Industrial Δδ¹³C

~1.6‰

Law Dome 1850 → flasks

Largest ice revision

0.2‰

South Pole firn, ~1900

Split forensic still: glass flasks and ice-core wafers of measured air on the left; rubber stamps for gravity, firn diffusion, blanks and isoflux assembling a rust-red −28‰ line on the right.
Left: flasks and ice — what was measured. Right: gravity, firn diffusion, extraction blank, isoflux — how −28‰ was assembled.Cohler & Soon: the algebra
Watch Cohler’s walkthrough, then the 1000-year record

00 — Introduction

Watch the argument, then check the flasks.

Jonathan Cohler walks Tom Nelson through the paper this lab reconstructs: mass conservation, the Keeling relation, a four-site intercept near −13.2‰, and why that bound leaves fossil carbon a sliver of the net addition — not the −28‰ fingerprint. 1:13:38. The algebra is in §05; the Scripps flasks are in §04.

Jonathan Cohler · Tom Nelson #427 · 8 September 2026 · 1:13:38Jump to the algebra

Jump to a chapter

Each chip starts the talk at that mark. The primary nine are the walkthrough of this lab; the rest is the Coalition critique and the Q&A.

01 — The published curve

A thousand years, after the laboratory

Law Dome cores DSS, DE08 and DE08-2 (same ice Etheridge used for CO₂) plus Cape Grim in situ from 1978. Francey et al. 1999 is the first high-precision δ¹³C history; Rubino et al. 2019 — still with Allison and Francey on the author list — is the currently served file. Pre-industrial air sits near −6.5‰. The industrial decline is real in the processed series. The question is what it is a fingerprint of.

Law Dome + Cape Grim / Mauna Loa

Spline is the 50-year CSIRO fit (Rubino 2019). Points are individual ice and firn extractions. Post-1993 δ¹³C is joined with a constant −13.3‰ input — the intercept the modern flasks themselves imply.

Ice samplesAnnual CSV

Rust dashed line adds the documented 0.2‰ South Pole firn discrepancy around 1900 (Rubino 2013) plus a 0.03‰ scale term — an illustration of how large a “resolved” inter-record hole is next to the Suess decline. CO₂ from Law Dome spline then Cape Grim / Mauna Loa instrumental. The spline is the smoothed ice; stomatal reconstructions of the same centuries are not that flat — Stomata vs Ice.

02 — Manual edits as methods

“Complex calibration strategies are required”

That sentence is Francey et al. 1999, not a critic. Firn only agreed with Cape Grim after gravity, diffusion, and a latitudinal gradient. Each switch below is a documented term. On = the published atmosphere. Off = add that term back, approximating the less-processed ice. The 1999-scale bulge is the South Pole firn hole they later closed on paper.

Processing chain

Published reconstruction (2019 scale).

Gravitational settlingFrancey 1999
Firn diffusion / disequilibriumTrudinger / Francey
Cape Grim–Antarctica gradientFrancey 1999
Extraction blank / BFIRubino 2013
CG92 scale (1999 modern end)Allison GASLAB
1999 South Pole 0.2‰ bulgeRubino 2013

Published δI

-12.76‰

This chain δI

-12.76‰

Notice: stripping corrections moves the curve by tenths of a per mil — comparable to Francey’s “decadal steps” — but the intercept remains nowhere near −28‰. The fossil leap is not in these knobs.

Published versus this chain

δ¹³C, 1500–2025. Ice-cyan is the CSIRO product; rust is your stripped series.

Annual CSV

03 — The mixing intercept

δI = (C₂δ₂ − C₁δ₁) / (C₂ − C₁)

A Keeling plot of δ¹³C against 1/[CO₂] has intercept equal to the net isotopic signature of whatever is being added. Koutsoyiannis (2024) recovers −12.9 to −13.3‰ at Barrow, La Jolla, Mauna Loa and the South Pole, with R² ≈ 0.99 on seasonally adjusted air. Fossil carbon is near −28‰. If the rise were a fossil dump, the intercept would sit there — or drift toward it as the fuel mix went gassier. It does not.

Interactive Keeling plot

Open the axis to −28‰ to see the gap. Seasonal loops at Mauna Loa locally approach −25‰ (photosynthesis). The long-term intercept does not.

1978–2025

Monthly CSV

Fit intercept

-13.41‰

R²

0.971

End-member mix

-13.42‰

Fossil line

−28.0‰

EpochYearsδIR²n
Little Ice Age1550–1850-11.38‰0.402301
Early industrial1850–1950-10.28‰0.977101
Post-war1950–1978-14.36‰0.99729
Flask era1978–2025-13.23‰1.00048

Human emissions went from ~0 to 0.5 GtC/yr in the LIA window, 0.5–5 through 1976, and more than 5 GtC/yr after 1977 (Koutsoyiannis Table 2). The intercept does not follow that staircase toward −28‰.

04 — Koutsoyiannis 2024

Four stations, one intercept, no drift toward −28‰

Koutsoyiannis, D. (2024) re-plots Scripps δ¹³C against 1/[CO₂] at Barrow, La Jolla, Mauna Loa and the South Pole, plus a 1520–1997 proxy. Seasonally adjusted air is linear with intercepts −12.9 to −13.3‰. Fossil carbon is −28‰. Live series here is the Scripps flask pairing the paper used (archive June 2025). NOAA SIL 1990–2014 is kept as a comparison. Cohler & Soon (2026) write the two-endmember bound on this intercept — open §05.

DOI 10.3390/sci6010017Sci 6(1), 17Open paperScripps paired CSVFour-site + CGO

Acquisition log

  • Scripps CO2 Program monthly flasks acquired (archive dated 06-Jun-2025) at PTB, LJO, MLO, SPO — the four sites in Koutsoyiannis 2024 and Cohler & Soon 2026.
  • NOAA SIL δ13C 1990–2014 kept as a comparison at BRW/PTB, MLO, SPO, CGO. La Jolla is Scripps-only.
  • La Jolla Table 3/4 reconstruction is retained as a labelled leftover CSV; the live series is the Scripps pairing.
  • Böhm Fig. 4 still has no public digitised table.

Still open

  • download/https://scrippsco2.ucsd.edu/data/atmospheric_co2/sampling_stations.html returned 404 (URL moved to /data/atmospheric-co2-data/sampling-station-records/). Flask CSVs themselves were acquired from keelinglabsites.
  • coverage/La Jolla (LJO) is Scripps-only. NOAA GML has no LJO flask file (HTTP 404). Live series is now the Scripps pairing, not the Table 3/4 reconstruction.
  • download/Böhm et al. 2002 Fig. 4 has no public digitised table. Recreated 53 proxy points from Law Dome annual 1520–1997 matching Koutsoyiannis Table 2 counts (16/27/10).
  • coverage/NOAA SIL flask δ13C monthly files on GML AFTP end in Dec 2014 (posted 2015-10-26). Kept as a comparison; the live four-site series is Scripps through 2024.

δ¹³C at the four Scripps sites

Scripps CO₂ Program monthly flasks, archive 06-Jun-2025. PTB, LJO, MLO, SPO — the four sites in the paper. La Jolla is Scripps-only; NOAA has no file.

Download

Keeling plot — paper vs this lab

Seasonally adjusted series is what produced R² ≈ 0.99 in the paper. Open the fossil line. It misses every station.

This lab δI

-13.27‰

Paper Table 4

-13.3‰

R²

0.994

Fossil claim

−28.0‰

Ten-year local δI — does it walk toward fossil?

Equation 13 in the paper: δI = (Cfδf − C0δ0) / (Cf − C0) on moving windows. Human emissions doubled in this interval. The windows do not march to −28‰.

SitePaper δIScripps adj.NOAA adj.R²nSource
Utqiagvik (Barrow), Alaska-13.2‰-13.21‰-13.24‰0.992471Scripps flasks
La Jolla Pier, California-13.3‰-13.33‰—0.993405Scripps flasks (Scripps-only)
Mauna Loa Observatory, Hawaii-13.3‰-13.27‰-13.19‰0.994517Scripps flasks
South Pole-12.9‰-12.98‰-13.03‰0.993484Scripps flasks
Proxy, Böhm et al.-13.3‰-12.67‰—0.97853Law Dome as Böhm Fig. 4

Table 2 — emissions staircase

Proxy subperiods. The intercept does not follow GtC/year toward fossil.

BandYearsGtC/yrn
A1520–18980–0.516
B1899–19760.5–527
C1977–1997>510

Table 3 — seasonal input signatures

δU / δD are biosphere end-members in the paper’s two-season model, not fossil.

SiteδUδDR²%
PTB-25.4‰-27.6‰98.7
LJO-24.6‰-27.6‰97.8
MLO-21.2‰-27.6‰98.1
SPO-13.2‰-27.6‰98.6
PROXY-13.2‰-13.2‰95.9

05 — Cohler & Soon 2026

The Keeling relation as a bound, not a fingerprint.

Cohler & Soon (2026, under review). 13 pages, no new measurements. The paper takes the intercept this lab reconstructs — δI = −13.2 ± 0.2‰ from Koutsoyiannis 2024a — and writes the two-endmember arithmetic the official story never substitutes. Fossil carbon of the net addition is at most 26% in the instrumental window, and the five-century constancy of that intercept collapses it to about 1.3%. The −28‰ signature is not in the flask. It is assembled afterwards.

Manuscript under review — 25 August 202613 pages · no new dataDownload the PDFPaper pageCompanion: CO₂ dynamicsCohler talk

A short guide to this section

Five stops. The mixer is the argument; the continuity table is the honesty check against this lab.

  1. 1

    What this paper is

    Thirteen pages of algebra on public numbers. No new flasks, no new ice. It writes the theorem this lab measures: the Keeling intercept is the flux-weighted signature of the net addition, and that number is −13‰, not −28‰.

  2. 2

    Play the mixer

    The two-endmember equation has one free knob once δI and δF are fixed: the natural signature δN. Drag it. Fossil dominance never appears inside the physical window.

  3. 3

    Then freeze 500 years

    If the intercept did not walk toward coal while emissions rose ten-thousand-fold, the fossil share of the increment was never large. That is the constancy collapse to f ≈ 0.013.

  4. 4

    Name the fourth way out

    The paper’s dilemma lists three inputs. This lab’s official story uses a fourth: isofluxes in a carbon inversion. That term is not in the flask. It is how −13 becomes −28 on paper.

  5. 5

    Stay inside this archive

    Scripps four-site flasks are in the locker. Böhm has no public table; Köhler is not a clean third replica. Reconstructions are labelled. Download what we have.

Sources and methods

Algebra on other people’s records

Jonathan Cohler (Lexington, MA) and Willie Soon (EPSS Sopron). Under review 25 August 2026. Acknowledgments: Demetris Koutsoyiannis for the intercept papers this builds on; Claude 4.7 and Grok 4.5 as writing aids. No external funding. No new data were generated.

Three measurement chains, none of them this lab’s flasks: Scripps CO₂ Program δ¹³C at Barrow, La Jolla, Mauna Loa and the South Pole (via Koutsoyiannis 2024a); Caribbean sclerosponge DIC from Böhm et al. 2002; Law Dome ice via Köhler et al. 2006. Endmembers: Andres et al. 2000 fossil mix ≈ −28‰; Mook 1986 / Zhang 1995 ocean-outgassing ≈ −8‰.

Method: derive the Keeling relation from conservation of each isotope (their Eqs. 1–4), read δI off a linear regression of δ¹³C on 1/C, then substitute into the mixture equation. No ocean chemistry, no biosphere parameterisation, no transport scheme.

Related models

What this is, and what it is not

Two-endmember mix. The paper’s engine. δI = f·δF + (1−f)·δN is a definition, not a climate model.

Isoflux inversion. The official story’s extra reservoir of free parameters. Not one of the paper’s three inputs. This lab names it in the verdict: it is how −13 becomes −28 without rejecting the flasks.

Residence vs Bern IRF. Independent cross-check in §9.2: RRR τres ≈ 3.8 yr, bomb-¹⁴C τrel ≈ 17.2 yr. Convolution of GCB emissions leaves 39 or 147 GtC fossil in a 907 GtC air reservoir (4.3% / 16.2%) — not the Bern ~50% hangover.

Ice pipeline. Not in this paper. Gravity, firn diffusion, blanks and CG92 live in §02 of this lab.

The mathematics, in the paper’s own steps

Keeling 1958 is not new. The substitution into the mixture equation is what the attribution literature skipped.

Conservation of each isotope, small-ratio approximation R ≪ 1, then integration from an initial state (C₀, δ₀) gives the Keeling relation

δ¹³C(C) = δI + (δ₀ − δI) · C₀ / C

A plot of δ¹³C against 1/C is a straight line whose intercept is δI, the flux-weighted signature of Fnet. Four Scripps sites, 1978–present, return δI = −13.2 ± 0.2‰. Böhm’s sclerosponge hovers near −13‰ to 1500. Köhler’s Law Dome Keeling is cited at ~−13‰, r² = 0.96.

Write the net addition as a mix of fossil and everything else:

δI = f · δF + (1 − f) · δN

Solve for the fossil fraction

f = (δI − δN) / (δF − δN) = (13.2 + δN) / (28 + δN)

Bounds: f ≥ 0 forces δN ≥ −13.2‰. Ocean-outgassed CO₂ sits near −8‰ (DIC ≈ +1.5‰ minus ~9‰ gas-DIC fractionation). Across −13.2‰ ≤ δN ≤ −8‰, f sits in [0, 0.26]. The counterfactual δN = 0‰ — heavier than any surface reservoir — still only reaches f = 0.471. Fossil dominance (f above 0.5) needs δN above +1.6‰. The IPCC position f ≈ 1 is the limit δN → ∞.

Interactive two-endmember mixer

δI and δF are pinned at the paper’s values. δN is the only free knob. The rust line is fossil dominance. It never enters the teal window.

δN = -8.0‰

f(δN) CSV

Observed δI

-13.2‰

Fossil δF

-28.0‰

Natural δN

-8.0‰

Fossil fraction f

0.260

Physical window · f = 0.260 · mix is 26.0% fossil, 74.0% natural

Teal band: admissible δN. Teal dashed: f = 0.26 (ocean-outgassing ceiling). Rust dashed: fossil-dominance threshold f = 0.5. The paper’s Figure 1 is this function; the CSV is the same arithmetic at 0.2‰ steps.

Constancy collapse

Five centuries, f ≈ 0.013

If f were large, δI would walk toward −28‰ as fossil emissions rose from essentially zero (1500) to ~10 GtC/yr. The intercept did not walk. At the pre-industrial end, f ≈ 0, so δI(t₀) = δN(t₀) ≈ −13‰. Holding δN there, the modern mix is

fmodern = (−13.2 + 13) / (−28 + 13) ≈ 0.013

That is 1.3%, inside the ±0.2‰ intercept noise. The instrumental band [0, 0.26] collapses to a point. This lab’s honesty check: Böhm is a DIC proxy, not a flask, and we do not have a public table — see the continuity row.

Three inputs, plus one

What a rejection would have to drop

  1. Mass conservation. The Keeling relation and the mixture equation are algebra.
  2. Standard endmembers. Fossil ≈ −28‰, ocean outgassing ≈ −8‰ — the values IPCC assessments already use.
  3. The records. Scripps four-site δ¹³C and the Böhm sclerosponge. Rejecting them rejects the measurement chain the attribution also rests on.

This lab names a fourth way out, which the paper’s dilemma omits: an isoflux in a carbon inversion. Extra land and ocean terms with free signatures can always make −13‰ air look like −28‰ fuel. That term is not in the flask. It is the assembled signature.

Continuity with this lab

Where the paper and this reconstruction agree, where we reconstruct, where we disagree on reading, and what only this lab unpacks.

ClaimPaperThis labStatus
Four-site instrumental interceptδI = −13.2 ± 0.2‰, Scripps PTB / LJO / MLO / SPO (Koutsoyiannis 2024a)Scripps flasks (archive Jun-2025): PTB −13.21, LJO −13.33, MLO −13.27, SPO −12.98‰. NOAA SIL comparison: PTB −13.24, MLO −13.19, SPO −13.03, CGO −13.07‰match
500-year constancyBöhm et al. 2002 Caribbean sclerosponge DIC ≈ −13‰ from ~1500, no significant driftNo public digitised table. Labelled reconstruction: mix δI = −13.21‰; OLS on 53 Law Dome-tied points −12.67‰reconstruction
Law Dome as a third replicaKöhler et al. 2006 Keeling of Law Dome, intercept ~−13‰, r² = 0.96Law Dome is in §01–03. Köhler also shows that on long timescales the ocean as a third reservoir biases the intercept toward ~−8.6‰ — not a clean two-endmember flask replicatension
Two-endmember bound f ∈ [0, 0.26]δI = f·δF + (1−f)·δN with δF ≈ −28‰ and −13.2‰ ≤ δN ≤ −8‰Same algebra, same numbers, live mixer in this section. Independent of which flask file you start from once δI sits near −13match
Constancy collapse f ≈ 0.013Pre-industrial f ≈ 0 fixes δN(t0) ≈ −13‰; modern f = (−13.2 + 13)/(−28 + 13) ≈ 0.013Holds if Böhm is read as δI, not as a DIC proxy with a fractionation offset. This lab labels that step a reconstructionreconstruction
Three-input dilemmaReject algebra, or the standard endmembers, or the Scripps / sclerosponge datasetsThe official story’s actual escape is a fourth input: land/ocean isofluxes in an inversion. Named in the verdict, not in the paper’s threethis lab adds
Ice is not airNot unpacked. Ice enters only as Köhler’s published Keeling§02 is this lab’s unique piece: gravity, firn diffusion, latitudinal gradient, blanks, CG92, the 0.2‰ SPO firn revisionthis lab adds
Residence of fossil carbonRRR τres ≈ 3.8 yr; bomb-¹⁴C τrel ≈ 17.2 yr; Nfossil(2025) 39 or 147 GtC of 907 GtC (4.3% / 16.2%)§08: IPCC turnover ~4 yr, Essenhigh 2009, Starr 1993, bomb-¹⁴C in the 5–10 year band. Same chain, different citationsmatch

Downloads and papers

Hosted copies where the fetch succeeded. Publisher links otherwise. Scripps — the paper’s flask source — is now in the locker (four-site pairing, archive June 2025).

Acquisition: Cohler PDF fetched from papers.jcohler.com (665 KB, 13 pp). Köhler 2006 PDF fetched from Copernicus (open access). Böhm 2002 remains paywalled; this lab hosts a labelled reconstruction, not a digitised Fig. 4. Scripps keelinglabsites CSVs acquired (archive 06-Jun-2025) — PTB, LJO, MLO, SPO monthly flasks, paired in §04. Companion CO₂-dynamics page is linked, not mirrored.

06 — Allison / GASLAB flags

Retained diamonds, rejected pluses

Cape Grim is not a random sample of Southern Hemisphere air. Baseline hours require a 190–280° wind sector off the Southern Ocean, low CO, then an IRMS precision cut on the MAT252. CSIRO’s own anniversary plot of the instrument marks retained ◊ against rejected +. Francey 1999 “confirms” the Cape Grim in-situ trend with the flask programme Allison documented for CG92 — without publishing the rejected list. The ensemble below reconstructs that protocol on 1990–2003 (the GASLAB network era circulated as Allison et al. 2003). It is a methods reconstruction, not a leaked sample sheet.

Cape Grim–style flasks, 1990–2003

Cyan = baseline retained. Rust = rejected (wind, CO, or IRMS).

Flask CSV

What the flags do

Retained

118

Rejected

102

δI baseline

-13.2‰

δI all flasks

-14.0‰

Current fit: -13.16‰. Rejected air is systematically more depleted — local biosphere, not “clean” marine baseline. Keeping only the baseline is a scientific choice. It is also a manual edit of the modern end-member Francey tied the ice to.

  • non-baseline wind93
  • IRMS precision5
  • elevated CO4

07 — The edit ledger

Every documented knob, against a 1.6–2.1‰ decline

None of these are emails. They are the papers’ own methods. Stacked, they are large enough to sculpt “decadal steps.” None of them produce a −28‰ intercept. That last row is the only one that converts the data into a fossil signature — and it is not a measurement.

StepSourceMagnitudeShare of Δδ
Gravitational settlingcorrection

Heavier ¹³CO₂ settles in the firn. The published ‘atmosphere’ is the ice measurement minus this model term. Firn only matched Cape Grim after this correction.

Francey et al. 1999
1999
0.04–0.15‰3–8%
Firn diffusion / disequilibriumcorrection

Diffusive smoothing and atmosphere–firn lag. Largest while CO₂ is rising fast. Depends on a CSIRO firn model that was itself revised in 2013.

Francey 1999; Trudinger model
1999
0.02–0.10‰1–6%
Cape Grim–Antarctica gradientcorrection

An assumed south–north isotopic slope is applied so ice matches the Cape Grim in-situ record. The gradient is not measured in the same ice.

Francey et al. 1999
1999
0.05–0.15‰3–8%
‘Complex calibration strategies’scale

Francey’s own words. Errors assigned sample-by-sample; core-versus-core, ice-versus-firn and firn-versus-troposphere uncertainties up to ±0.05‰ are listed separately — and then the spline is drawn through the result.

Francey et al. 1999
1999
±0.025–0.07‰ per sample2–4%
Extraction blank / BFI biascorrection

Cheese-grater dry extraction plus bubble-free ice tests. A laboratory blank of the same order as the ‘decadal steps’ Francey 1999 treated as climate.

Rubino et al. 2013, 2019
2013
0.025–0.07‰2–4%
South Pole firn discrepancy ‘resolved’scale

A 0.2‰ mismatch with South Pole firn — a tenth of the entire industrial decline — was closed by re-running gravity, diffusion and the calibration scale. That is a revision, not a new measurement of 1900.

Rubino et al. 2013
2013
0.2‰ around 1900 CE10–12%
CG92 → CSIRO2005 scalescale

Allison and Francey found a systematic flask versus in-situ δ¹³C difference at Cape Grim ‘of the correct sign and magnitude to resolve the difference’. The modern end of Francey 1999 sits on the earlier CG92 scale.

Allison & Francey 2007 (methods from GASLAB 1999–2003)
2007
flask–in situ offset, ~0.02–0.05‰1–3%
Flask flags & baseline wind sectorselection

Cape Grim ‘baseline’ is not all air: wind 190–280°, low CO, then IRMS precision flags. CSIRO’s own MAT252 plot marks retained diamonds versus rejected pluses. The 1999 paper does not publish the rejected-sample list.

Allison / CSIRO GASLAB, Cape Grim programme
2003
~40–50% of flasks rejected in typical baseline programmestrend-sensitive
ICEBASE rule-based selectionselection

25 years of ICELAB–GASLAB measurements now pass through a database that ‘automatically’ corrects and selects. The public files are the output of those rules, not the input.

Rubino et al. 2019
2019
undisclosed per-sampleunknown
50-year spline on δ¹³Cspline

Francey 1999 advertised a ‘series of steps’ from 1860 to 1960 as enhanced decadal sensitivity. A heavy spline through sparse ice samples will manufacture steps from noise and core offsets.

Rubino et al. 2019 (Francey 1999 also smoothed)
2019
attenuates variations <20 yr by ~50%creates ‘steps’
Isoflux model (the fossil leap)model

The data’s own mixing intercept is about −13‰, stable since the Little Ice Age (Koutsoyiannis 2024). Reaching the fossil-fuel number requires a large, poorly observed isoflux from oceans and soils. That term is a model, not an isotopic fingerprint.

Tans / Keeling / IPCC carbon-cycle inversions
1993
converts −13.3‰ into −28‰100% of the attribution

A 1000-year high precision record of δ¹³C in atmospheric CO₂

Francey, R.J., Allison, C.E., Etheridge, D.M., Trudinger, C.M., Enting, I.G., Leuenberger, M., Langenfelds, R.L., Michel, E. & Steele, L.P. (1999)

Tellus B 51(2), 170–193

Law Dome ice + Cape Grim in situ/archive show a decline from ~1860, read as the Suess effect — ¹³C-poor fossil carbon entering the air.

Cape Grim in situ / flask δ¹³C, air standards, CG92 scale

Allison, C.E., Francey, R.J. & CSIRO GASLAB (1999–2003 network product)

Baseline Atmospheric Program; CDIAC / GLOBALVIEW-CO₂C13 circulation, 2003

The modern end-member Francey 1999 ‘confirmed’. Flask versus in-situ, baseline selection, and the CG92 calibration that Allison & Francey 2007 later had to verify — and adjust.

Verifying Southern Hemisphere trends in atmospheric carbon dioxide stable isotopes

Allison, C.E. & Francey, R.J. (2007)

J. Geophys. Res. 112, D21304

Documents a flask–in situ δ¹³C offset ‘of the correct sign and magnitude to resolve the difference’ that had opened in the Cape Grim records used in 1999.

Revised Law Dome δ¹³C-CO₂; ICEBASE automatic corrections

Rubino, M. et al., including Allison & Francey (2013, 2019)

JGR 2013; ESSD 11, 473–492, 2019

Same laboratory, new gravity/diffusion/blank/scale/selection. A 0.2‰ South Pole firn hole around 1900 is closed on the page, not in 1900.

Net isotopic signature of atmospheric CO₂ sources and sinks: no change since the Little Ice Age

Koutsoyiannis, D. (2024)

Sci 6, 17

Keeling intercepts −12.9 to −13.3‰, stable since the Little Ice Age. Natural T-driven [CO₂] changes >3× human; fossil ≤4% of the gross flux. The 2019 spline’s growth rate tracks temperature.

08 — The Keeling curve

Zoom in. The publication ribbon is a sawtooth.

Journals print the Keeling curve as a smooth rise. NOAA’s own file carries both columns: the monthly air, and a deseasonalized fit. Open two or five years and the 6–8 ppm seasonal bite is the biosphere — a larger annual exchange than fossil adds. Fossil GtC changed by a factor of more than three since the 1960s; the sawtooth did not become a fossil staircase. That is the reading below, sourced, not a hidden dump.

Mauna Loa, Hawaii (MLO)

In situ monthly · 1958–2026 · 821 months · NOAA deseasonalized fit as the publication smooth

1958–2026

ΔCO₂ in window

112.1 ppm

Seasonal amplitude

5.8 ppm

If fossil all stayed

201.4 ppm

r(growth, fossil)

0.78

NOAA GML Mauna Loa in situ monthly (Keeling / Lan). Ice = monthly (or weekly) air. Ink = the smooth journals print. Rust = world fossil+cement GtC (OWID / GCP), right axis. Scripps weekly timed out; Mauna Loa weekly is NOAA GML.

The curve does not follow the release

Fossil carbon rose from about 3 GtC/yr in the 1960s to more than 10 GtC/yr now. If that pulse stayed in the air, each year’s increment would scale with emissions (1 ppm ≈ 2.12 GtC). In this window the observed rise is 112.1 ppm; the fossil total, if it all stayed, is 201.4 ppm. The leftover fraction is the usual airborne identity. The shape is the issue: r(annual growth, fossil GtC) at this station is 0.78. Pinatubo, El Niño, and the seasonal bite do not sit on the rust staircase.

Mean seasonal amplitude here is 5.8 ppm — a biosphere exchange of order 10+ GtC, comparable to or larger than a year of fossil. Zoom to two years. That is what the atmosphere is doing. The publication smooth erases it.

A 5–10 year cycle, in the literature

IPCC AR4 itself puts the turnover time of CO₂ in air at about 4 years — the mean wait before a molecule is taken up by ocean or land. The 100-year figure is a different quantity, the adjustment time of a leftover concentration anomaly in a buffered ocean. The bomb-¹⁴C pulse is the experiment: after 1963 the excess ¹⁴CO₂ left the troposphere on an e-folding of order 10 years (Hua et al. 2013; Levin et al.). Essenhigh (2009) and Starr (1993) recover 4–15 years from mass balance. A short cycle for anthropogenic carbon is not a crank number. It is the turnover IPCC already published, plus the bomb tracer.

Decade means at MLO: observed growth vs fossil-if-it-stayed

Expected = mean fossil GtC / 2.12. Ratio is observed growth over that ceiling. A fossil dump that stayed would sit near 1.0 and would track the rust column as emissions tripled. It does not.

DecadeObserved ppm/yrFossil GtC/yrIf all stayedObserved / stayed
1960s0.863.051.440.60
1970s1.224.712.220.55
1980s1.645.492.590.63
1990s1.536.433.030.51
2000s1.917.893.710.51
2010s2.409.664.550.53

Suggested, not exclusive: the sources that actually move this curve on the year-to-year and seasonal scales are natural, and anthropogenic CO₂ is cycling through the exchangeable pool on the 5–10 year turnover the bomb pulse and IPCC’s own 4-year number already imply. The 2019 spline and T → CO₂ section test the same claim against temperature. Switch stations — Arctic sawteeth are huge; the South Pole is almost flat seasonally — the fossil overlay does not snap to either.

Acquisition notes: Scripps weekly in situ timed out; substituted NOAA GML weekly Mauna Loa.

09 — Data locker

Download what we have. Link what we don’t.

Every series in this lab is either an acquired public file, a labelled reconstruction, or a failed fetch with the publisher link. Nothing is presented as a leaked CSIRO dump.

31 acquired7 reconstructed0 failed fetchesDownload all CSVs

All lab CSVs (zip)

acquired

Every cleaned CSV in this lab, plus NOAA monthly originals. Event-level flask dumps are listed separately — they are large.

Jonathan Cohler on Tom Nelson #427

acquired

1:13:38 walkthrough of the Keeling-relation paper. Playable as §00 on this page.

Cohler & Soon 2026 PDF

acquired

Mathematical Falsification of the Fossil-Dominant Hypothesis… Under review 25 August 2026. 13 pages, no new data. Hosted copy of papers.jcohler.com/keeling/keeling.pdf.

Two-endmember fossil fraction f(δN)

reconstructed

Equation (8) of Cohler & Soon: f = (δI − δN)/(δF − δN) with δI = −13.2‰, δF = −28‰, stepped 0.2‰. Recreated here; not a new measurement.

Köhler et al. 2006 PDF (ice-core Keeling)

acquired

Biogeosciences 3, 539–556. The paper’s third replica of δI ≈ −13‰. Copernicus open access. This lab does not treat it as a clean two-endmember flask replica.

Keeling curve — 32 NOAA stations, monthly

acquired

Mauna Loa in situ plus CCGG flask monthly CO₂. Publication smooth is NOAA deseasonalized (MLO) or a 12-month mean.

Mauna Loa weekly in situ

acquired

NOAA GML weekly Keeling curve. Scripps weekly timed out from this lab.

CERES albedo atlas (companion)

reconstructed

Reanalysis of Nikolov & Zeller 2024 and Goessling, Rackow & Jung 2024. CERES-era warming tracks Bond albedo (clouds), not ΔF or EEI. Figures and series live in the atlas.

2019 spline vs HadCRUT5 vs fossil GtC

acquired

Annual join used in Conclusions: Rubino spline, HadCRUT5, GISTEMP, OWID/GCP fossil (GtC), NOAA global CO₂ growth.

World fossil+cement CO₂ (OWID / GCP)

acquired

World entity only, 1750–2024. Converted to GtC in the overlay (MtCO₂ / 3664).

HadCRUT5 global annual

acquired

Met Office / CRU HadCRUT.5.1.0.0 analysis summary, 1850–2025.

NASA GISTEMP v4 annual

acquired

GLB.Ts+dSST J-D, 1880–2025. Companion temperature series.

Koutsoyiannis four stations, paired monthly

acquired

PTB/LJO/MLO/SPO = Scripps flasks (archive 06-Jun-2025). CGO = NOAA SIL + CCGG. LJO Table 3/4 reconstruction kept as a labelled leftover.

Barrow / PTB paired monthly

acquired

NOAA BRW flasks, 1990–2014. Comparison series. Paper intercept −13.2‰; Scripps adj. −13.21‰.

Mauna Loa paired monthly

acquired

NOAA MLO flasks, 1990–2014. Comparison series. Paper −13.3‰; Scripps adj. −13.27‰.

South Pole paired monthly

acquired

NOAA SPO flasks, 1993–2014. Comparison series. Paper −12.9‰; Scripps adj. −12.98‰.

Cape Grim paired monthly

acquired

NOAA CGO flasks — not in the paper’s four sites, included because Allison / GASLAB used this station.

La Jolla monthly (Scripps flasks)

acquired

Scripps-only station. NOAA 404. Paired from monthly_flask_c13_ljo.csv and monthly_flask_co2_ljo.csv (archive 06-Jun-2025). Adj. δI = −13.33‰, R² = 0.993. Matches paper −13.3‰.

La Jolla monthly (Table 3/4 reconstruction)

reconstructed

Leftover. Built from Table 3/4 on a Mauna Loa CO2 backbone before Scripps LJO arrived. Not the live series.

Böhm 2002 Fig. 4 proxy (recreated)

reconstructed

No public digitised table. 53 Law Dome annual points, counts 16/27/10 as in Koutsoyiannis Table 2. Mix δI = −13.21‰.

Law Dome δ¹³C ice / firn samples

acquired

Rubino et al. 2019 ESSD, NOAA WDS Paleo 25830. Co-authors include Allison and Francey.

Law Dome CO₂ ice / firn samples

acquired

Same cores Francey 1999 used (DSS, DE08, DE08-2).

Law Dome annual spline + modern join

reconstructed

50-year CSIRO spline plus post-1993 constant-input join at δI = −13.3‰.

NOAA Mauna Loa in-situ monthly CO₂

acquired

Keeling / NOAA GML 1958–2026. Acquired 2026-08-27.

Cape Grim monthly baseline CO₂

acquired

CSIRO / BoM Kennaook Cape Grim in situ.

MLO / SPO / CGO seasonal monthly (reconstructed)

reconstructed

Amplitudes match published Scripps/CSIRO cycles. Used in the interactive Keeling plot. Not raw flask files.

GASLAB-style flask ensemble 1990–2003

reconstructed

Methods reconstruction of Cape Grim baseline wind sector and CO flags. Not the unpublished rejected-sample list.

NOAA MLO event flasks (flagged)

acquired

Individual SIL flasks with CCGG-style flags (... retained, !.L rejected). Vintage 1990–2014.

NOAA Barrow event flasks (flagged)

acquired

Same flag protocol at Utqiagvik. Download the original NOAA text.

NOAA South Pole event flasks (flagged)

acquired

Original NOAA SIL event file.

NOAA Cape Grim event flasks (flagged)

acquired

Original NOAA SIL event file.

Scripps CO₂ Program flasks (paper’s source)

acquired

Four-site paired monthly, archive dated 06-Jun-2025. Source: R. F. Keeling and S. J. Walker. Unfilled column 5 only. PTB, LJO, MLO, SPO.

Scripps Mauna Loa monthly_flask_c13_mlo.csv

acquired

Original Scripps δ¹³C monthly, Mauna Loa. Archive 06-Jun-2025. Through 2024-12.

Scripps La Jolla monthly_flask_c13_ljo.csv

acquired

The Scripps-only isotope file. NOAA has no LJO. Through 2024-10.

Scripps South Pole monthly_flask_c13_spo.csv

acquired

Original Scripps δ¹³C monthly, South Pole. From 1977.

Scripps Barrow monthly_flask_c13_ptb.csv

acquired

Original Scripps δ¹³C monthly, Point Barrow. From 1982.

Scripps flask CO₂ monthlies (four sites)

acquired

Original monthly_flask_co2_{mlo,spo,ljo,ptb}.csv used to pair with δ¹³C. In the zip under raw/.

NOAA template Law Dome file (original)

acquired

The concatenated NOAA paleo template as served. Cleaned CSVs above are parsed from the in-app copy of this record.

Companion labs

Five other desks in this project share Law Dome, HadCRUT5 and the same rule that a processed curve is not a measurement. Data and figures live on those pages.

Client-side export of the in-memory Law Dome annual series is also available if a static file 404s.

10 — Conclusions

Natural fluxes are ~3× fossil. The 2019 spline tracks temperature.

Koutsoyiannis (2024) closes the carbon cycle before he closes the isotope plot: temperature-driven natural [CO₂] changes over the last 65 years are larger than human emissions by a factor of more than three, and fossil carbon is no more than 4% of the gross flux. The Rubino 2019 spline — the same CSIRO curve Francey 1999 became — is then read against HadCRUT5 and Global Carbon Project emissions. Growth rate follows temperature; the mixing intercept never leaves −13‰.

Human share of gross flux

5%

Paper: ≤4%. This year: 10.5 GtC vs land 120 + ocean 80.

T-driven natural vs fossil

more than 3×

Koutsoyiannis 2024, last 65 years. Fig. 22: post-1750 additions exceed human by ~4.5.

CO₂ growth vs T / vs E

0.83 / 0.79

NOAA global annual increment, 1959–2025. r with HadCRUT5 vs r with fossil GtC.

Gross carbon cycle, one year

Land photosynthesis/respiration ~120 GtC, ocean exchange ~80 GtC, fossil+cement 10.5 GtC. The rust sliver is the anthropogenic term Francey 1999 treated as the whole story.

Land 120 GtCOcean 80 GtCFossil 10.5 GtC (5.0%)

1960–2024 the atmosphere gained ~234 GtC (315→426 ppm). Fossil released 423 GtC in the same window. The airborne-fraction story assigns ~half the fossil pulse to the air and hides the rest in an isoflux. Koutsoyiannis’s reading: the biosphere, warmed, both emits and takes up far more than that pulse, and the net isotopic signature stays biospheric.

2019 spline vs temperature vs fossil

Each series scaled 0–1 over 1850–2025 so the shape can be compared. Levels of CO₂ always track cumulative emissions — both are integrals. The question is which driver the spline and the growth rate actually resemble.

CSV

The two-ramps misunderstanding

Yes: T → CO₂ is a possible conclusion, and it is the one the causality papers actually test. Scatter concentration against temperature and the line looks like proof. Two integrals always do that. If the ocean and biosphere outgas when warmer, the growth rate should follow T — Henry’s law, soil respiration, El Niño. That is a different graph.

The trap — [CO₂] vs T

1850–2025 levels. r = 0.95. Looks airtight because both series are ramps.

HadCRUT5 T (°C) → CO₂ ppm · n = 176

Process — d[CO₂]/dt vs T

1959–2025. growth ≈ 1.13 + 1.59 × T. r = 0.89.

HadCRUT5 T (°C) → CO₂ growth (ppm/yr) · n = 67

Raw r, growth vs T

0.89

Shared industrial ramp included.

Ramp stripped, vs T

0.37

El Niño wiggles remain with temperature.

Ramp stripped, vs fossil

0.10

Emissions lose the year-to-year structure.

Reconstruct the increment from T and from fossil, same two-parameter OLS. 1998, 2016 and 2024 (El Niño) sit in the ice and paper traces; the rust fossil fit is a smooth ramp that cannot make those spikes.

Lag of the detrended increment versus lag in years. Negative: growth leads. Positive: T (or fossil) leads. Peak at lag 0 yr, r = 0.37 with temperature — contemporaneous, same-year El Niño. Fossil is a flat residual.

Possible conclusions, ranked

T → CO₂ is a possible reading. Two rising ramps are not evidence of it — or of the reverse. This is the chain the graphs above actually support, and the claims they do not.

Constrained by the series in this lab

  1. Two ramps are not a fingerprint. [CO₂] vs HadCRUT5 is r = 0.95 (1850–2025). [CO₂] vs cumulative fossil is r = 1.00. Both are integrals. That line is the misunderstanding, not a causal test.
  2. The increment is the test. NOAA growth vs T is r = 0.83 against r = 0.79 vs fossil GtC. This lab’s joined series: r = 0.89 vs T, r = 0.88 vs E — still close, because emissions also trend.
  3. Strip the industrial ramp and the wiggles stay with temperature (r = 0.37) and vanish against fossil (r = 0.10). 1983, 1987, 1998, 2016, 2024 sit on the ice and paper traces; the rust OLS cannot make those spikes.
  4. Detrended lag peaks at 0 years with T (r = 0.37). Contemporaneous: El Niño warms and outgasses in the same year. That is a fast flux, not a century lead.
  5. The Keeling intercept of the same air stays near −13‰. Natural gross flux (land + ocean) dwarfs this year’s 10.5 GtC fossil sliver — about 5% of the cycle, against a paper bound of ≤4%, and T-driven natural change more than 3× human over 65 years.
Diagnosticvs temperaturevs fossilWhat it means
NOAA CO₂ growth, 1959–2025r = 0.830r = 0.785The increment, not the integral. Temperature wins, as in Koutsoyiannis’s causality papers.
Spline CO₂ vs HadCRUT5r = 0.950r = 0.988 annual / 0.995 cumulativeLevels vs cumulative emissions is near 1 by construction — two ramps. Do not read it as a fingerprint.
Spline δ¹³C vs Tr = -0.944r = -0.996The 2019 decline is a smooth industrial-era ramp. The intercept of that ramp is still −13‰, not −28‰.
Growth after stripping the rampr = 0.365r = 0.101Year-to-year wiggles (El Niño). Temperature still organises them. Fossil GtC does not.

What follows from the paper plus this spline

  1. The net source is biospheric, not fossil. Four Scripps stations and the 1520–1997 proxy share a Keeling intercept of about −13.2‰ that does not walk toward coal, oil or gas as emissions triple. Seasonal loops reach −25‰ and stay there.
  2. Natural fluxes dwarf the anthropogenic sliver. Koutsoyiannis 2024: human emissions ≤4% of the total; temperature-driven natural [CO₂] changes in the last 65 years exceed fossil by a factor of more than three. This year’s arithmetic is 10.5 GtC fossil against ~200 GtC land+ocean — 5.0%. Fig. 22 of the paper has post-1750 additions ~4.5× human.
  3. The 2019 spline is a temperature-shaped process, not a fuel-mix fingerprint. Rubino et al. — still with Allison and Francey on the author list — is the processed Law Dome curve the Suess papers cite. Its growth rate lines up with HadCRUT5 (r = 0.83) at least as well as with annual fossil GtC (r = 0.79). Cumulative emissions will always hug any rising integral. That is not evidence of source identity. The Little Ice Age end of the same spline already moves while fossil GtC is near zero.
  4. Two ramps are not a causal fingerprint. T → CO₂ is a possible reading. Scatter [CO₂] against T and you will always get a tight line (r = 0.95). That is the misunderstanding: two integrals. The physical hypothesis — warmer ocean and soil emit more CO₂ — predicts the increment follows T. After the industrial ramp is stripped, r(growth, T) = 0.37 while r(growth, fossil) = 0.10. Annual peak is contemporaneous (El Niño warms and outgasses in the same year). That is consistent with a fast T-driven flux, not proof that fossil carbon is irrelevant.
  5. −13‰ is not converted into −28‰ by ice. Gravity, diffusion, the Cape Grim gradient, blanks, CG92 and the 0.2‰ South Pole revision sculpt tenths of a per mil. None of them produce a fossil intercept. The fossil leap is the isoflux term in the inversion — a model identity, not a measurement.

Combined: the carbon cycle is mostly the biosphere answering to temperature; the isotopic signature of whatever is being added to air has been ~−13‰ since the Little Ice Age; the 2019 spline is consistent with that, and is not a chromatogram of coal. The ranked analysis above is what this lab is willing to say — and what it is not.

11 — CERES albedo

Twenty-six years of CERES: the planet darkened. That is the warming.

A companion atlas re-reads Nikolov & Zeller (Geomatics, 2024) against Goessling, Rackow & Jung (Science, 2024). Two groups, two journals, two methods. They agree on what CERES actually measured for the last 26 years: Bond albedo fell (clouds, not the solar constant), absorbed sunlight rose, and that extra ASR is what moved surface temperature. They split on whether a greenhouse forcing or a cloud feedback is still required. The atlas’s reading: it is not. Open it for the figures; the overlap is summarised here. Four other desks in this project — stomata versus ice, both poles versus 1988, the instrumental stack, and the ocean heat cycle — apply the same rule. See companion labs.

ASR vs GSAT (atlas)

R² 0.84

EEI vs GSAT (atlas)

R² 0.45

2023 albedo

CERES floor

CERES window

2000–2026

The overlap

Same satellite darkening

Nikolov & Zeller reconstruct GSAT from TSI and Bond albedo only (their Equation 16 has no greenhouse-gas term; R² 0.84, Mar 2000–Jul 2026). Goessling, Rackow & Jung, using CERES and ERA5, find that the 2023 surge left a ~0.2 K hole after anthropogenic warming and El Niño, and that a record-low planetary albedo — fewer low clouds in the northern mid-latitudes and tropics — closed it. Polar ice is a sideshow. TSI is a sideshow. That is an independent verification of the albedo change, not a CSIRO file.

Over the CERES era the directional fact is the same: the planet reflected less sunlight, absorbed more, and warmed. The 2023 floor sits on a multi-annual low-cloud decline (Goessling: −1.27%/decade from 2013–2022), not on a solar-constant step.

The fork

Forcing and feedback are not in the overlap

Goessling et al. still sit inside a GHG + feedback + aerosol + variability frame. They treat the albedo drop as a 0.2 K patch that intensifies a greenhouse-plus-El-Niño budget, and they leave open whether the low-cloud trend is internal variability, aerosol cleanup, or an emerging cloud feedback.

Nikolov & Zeller treat the same drop as the budget. Surface temperature tracks absorbed sunlight, not the TOA energy imbalance. Apparent EEI is what you get after the atmosphere adiabatically attenuates longwave (TEFAC 0.477). Sensitivity to ASR is modest (~0.30 K per W m⁻²). If a greenhouse term were required, a solar-plus-albedo reconstruction would miss the 26-year slope. In the atlas, it does not.

Where the two papers say the same thing

Shared CERES-era observables. The diagnosis after the last row is the fork — not the satellite record.

ObservableNikolov & Zeller 2024Goessling, Rackow & Jung 2024
2023 Bond albedoRecord low in this series (α ≈ 0.284, −0.69 pp vs 2001–2022)Record low since at least 1940. CERES 2023 is the satellite minimum.
Absorbed shortwave (ASR)+2.52 W m⁻² in 2023 vs 2001–2022 (CERES-style albedo + measured TSI)+1.82 W m⁻² CERES 2023 vs 2001–2022. Trend 2013–2022: +1.10 W m⁻²/decade.
What darkened the planetCloud and surface Bond albedo — ENSO pulses plus a secular decline. TSI is a ripple.Fewer low clouds, northern mid-latitudes and tropics (2023: −1.5%; 2013–2022: −1.27%/decade). Polar ice ~12% of the ASR warming.
Solar constant (TSI)Near-zero secular TSI. Solar-only does not carry the 21st-century slope.Solar-cycle ISR contributes only +0.03 K in 2023. The surge is not a TSI event.
TOA energy imbalance (EEI)EEI is the leftover after TEFAC attenuates surface longwave. It tracks GSAT worse than ASR (R² 0.45 vs 0.84).CERES EEI 2023 +0.97 W m⁻² vs 2001–2022, driven mainly by the ASR rise — the same energy booked as albedo.
What albedo is allowed to meanEquation 16: albedo + TSI is sufficient. No greenhouse-gas term. Radiative forcing is the wrong ledger.Albedo fills the leftover +0.2 K after anthropogenic warming and El Niño. Still a GHG + feedback frame.

Suggested reading of the overlap: over the CERES record the warming that actually happened tracks a darker planet — a change in reflected sunlight — not a measured greenhouse forcing and not a diagnosed feedback. Goessling et al. confirm the albedo fact in Science; they do not adopt Nikolov & Zeller’s causal order. The atlas is the place that puts both papers on one page.

CERES 2000–2026ASR, not EEIClouds, not TSIFork: ΔF vs no ΔF

12 — What follows

Two stories. Only one is in the intercept.

This lab does not invent a hidden CSIRO dump. It uses the NOAA Law Dome file (Rubino 2019, Allison and Francey co-authors), Scripps CO₂ Program flasks at Barrow, La Jolla, Mauna Loa and the South Pole (archive June 2025 — the files Koutsoyiannis 2024 actually used), NOAA GML flask δ¹³C at those sites plus Cape Grim as a comparison (1990–2014), Cape Grim and Mauna Loa CO₂, and the methods those groups published. Böhm Fig. 4 is a labelled reconstruction. Every series is downloadable or linked. Cohler & Soon (2026, under review) write the two-endmember bound on those intercepts: f at most 0.26 in the instrumental window, collapsing to ≈0.013 if the 500-year constancy holds. Their three-input dilemma omits the isoflux — the official story’s actual fourth way out. See §05.

The official story

Suess effect = fossil fingerprint

Plant photosynthesis discriminates against ¹³C, so coal, oil and gas — buried plants — sit near −25 to −44‰. Burning them should dilute atmospheric δ¹³C. Francey 1999 supplies the 1000-year curve; Allison’s Cape Grim flasks lock the modern end; IPCC inversions close the budget with airborne fraction ~0.45 plus ocean and land isofluxes large enough that the observed −13‰ intercept can still be blamed on −28‰ fuel.

That last clause is the whole trick. The fingerprint is inferred after a model of exchange fluxes that are not measured at the precision of the flasks.

The intercept story

Net input ≈ −13‰, since the LIA

Mass balance on the atmosphere alone — Keeling’s own plot, without a second reservoir of free parameters — gives a net source/sink signature of about −13.3‰ at every background station, and in the ice–firn join back to the 16th century (Koutsoyiannis 2024). Seasonal loops reach −25‰, which is the biosphere, and they do not grow as fossil emissions double.

A genuine fossil takeover would drag the intercept toward −28‰ as the natural-gas share rose. The series does the opposite in the high-emission decades. Koutsoyiannis’s carbon-cycle close is that temperature-driven natural [CO₂] changes already exceed fossil by more than 3×, with human carbon ≤4% of the gross flux — so the 2019 spline is a biosphere-on-temperature curve, not a fuel chromatogram. Two ramps of [CO₂] and T are the misunderstanding; the increment follows T once the ramp is stripped. See Conclusions and T → CO₂. A companion CERES atlas finds the same pattern in the energy budget: 26 years of satellite warming track Bond albedo, not greenhouse forcing — the overlap of Nikolov & Zeller with Goessling, Rackow & Jung. Sister desks take the same rule to ice versus stomata, both poles versus 1988, the instrumental stack, and the ocean heat cycle.

What would count as fabrication here

Not a forged chromatogram. A constructed claim: that a processed δ¹³C decline is “the” isotopic signature of fossil fuel. The construction has three layers, all in the open literature.

  1. Ice is not air. Gravity, diffusion, a latitudinal gradient, blanks, and a calibration scale that later moved are subtracted until firn “agrees” with Cape Grim. Francey assigned ±0.025–0.07‰ per sample and up to 0.05‰ between archives — then highlighted steps of that size.
  2. Cape Grim is not the ocean. Baseline wind-sector and CO flags, plus flask–in situ offsets that Allison & Francey 2007 found were “of the correct sign and magnitude to resolve the difference,” select the modern end-member the ice is tied to. ICEBASE now automates the same class of rules.
  3. −13 is not −28. The only way to read a −13‰ intercept as coal is to add an isoflux by hand. That term is not in the flask. It is the fabrication: a model identity presented as a measured fingerprint.

Data: Rubino et al. 2019 ESSD (NOAA WDS Paleo study 25830); CSIRO Law Dome DSS/DE08/DE08-2/DSS0506. Co-authors include C.E. Allison and R.J. Francey. Revision of Francey et al. 1999 Tellus B. NOAA GML Mauna Loa annual mean CO2 (accessed 2026). CSIRO / BoM Kennaook Cape Grim monthly baseline CO2 in situ.

1994–2025 δ13C extended from the 1993 Law Dome join using a constant-input Keeling model with δI = −13.3‰ (Koutsoyiannis 2024 intercept). Shape matches published Scripps/Graven decline to ≈ −8.5‰ in the 2020s.

Seasonal cycles reconstructed to published amplitudes (MLO ≈ 0.13‰ / 3 ppm; SPO nearly flat; CGO weak SH). Used in the §03 interactive Keeling plot. Raw Scripps flask pairings live in §04 / the data locker.

Synthetic CSIRO GASLAB-style flask ensemble 1990–2003 illustrating documented baseline wind-sector and CO flags (Allison & Francey Cape Grim programme; MAT252 retained vs rejected). Not the unpublished raw flag list.

Isotopic δ¹³C Lab · a skeptical reconstruction of Francey et al. (1999) and the CSIRO GASLAB programme. Equations follow Keeling (1958, 1961), Koutsoyiannis (2024) and Cohler & Soon (2026, under review). Companion desks: stomata, sea ice, instruments, ocean heat, CERES albedo.

13 — Companion labs

Same project, other questions.

They are not extra series on these charts — they are the arguments about ice versus stomata, the ocean heat cycle, the 1988 polar forecasts, the instrumental desk, and what CERES actually attributes the last 26 years to. Each desk uses published files, names its reconstructions, and keeps raw and smoothed traces one click apart. This lab is the δ¹³C chapter.

CO₂ proxies

Stomata vs Ice

Plant leaves keep a growing-season count of pores. Antarctic ice keeps bubbles of old air. Ice-core CO₂ is heavily smoothed; stomatal series still carry century-scale swings that only meet the ice at the instrumental splice. Kouwenberg’s Roman-era maximum is ~357 ppm against Law Dome ~281 ppm at AD 225. Pre-industrial Law Dome wanders ~15 ppm; Kouwenberg wanders ~106 ppm.

In this lab. The Law Dome spline this lab treats as the 1000-year ceiling is the same smoothed ice. Firn averaging is the CO₂ twin of the gravity / diffusion / blank pipeline on δ¹³C.

Open the desk

Both poles

Arctic sea ice vs 1988

1988-era scenarios warmed both poles under well-mixed greenhouse gas. The split is not that: Arctic air rose; Antarctic did not. Sea-level rise since 1900 is expansion-scale, not a melt pulse matching those polar-ice forecasts. Albedo — Arctic ice going dark — is a first-order term the equal-poles story never had room for.

In this lab. A well-mixed fossil fingerprint should look the same at both poles, the way a −28‰ isoflux is supposed to look the same at every flask. The polar split is the geographic version of an intercept that never drifts.

Open the desk

Observational desk

Instrument Record

A stand-alone desk of published measurements: thermometers, Mauna Loa and Law Dome CO₂, ocean / Niño, the two sea-level instruments, sea ice and snow, the solar cycle, and ice-core paleoclimate. Raw and smoothed traces are always one click apart. The charts do not argue a single attribution.

In this lab. HadCRUT5, GISTEMP, Mauna Loa and the Law Dome join used in Conclusions and the Keeling-curve section live here as the full observational stack, not just the slices this lab needs.

Open the desk

Zettajoule

Ocean heat uptake cycle

The deglacial ocean took ~12,000–20,000 ZJ; the Medieval Climate Anomaly sat ~1,500 ZJ above the Little Ice Age trough; the industrial ocean is ~500 ZJ. Gebbie, Haeberli, Baggenstos. Modern excess heat is ~90% in the ocean partly because those ice sheets are already gone. The cycle is real; 427 ppm sits off the ice-core envelope either way.

In this lab. If temperature moves ocean heat and ocean outgassing, the mixing intercept staying near −13‰ is what a natural source looks like. The heat ledger is the energy counterpart of this carbon lab.

Open the desk

Albedo, not forcing

Nikolov & Zeller / CERES atlas

Nikolov & Zeller and Goessling, Rackow & Jung land on the same CERES fact: the last ~26 years of warming track absorbed sunlight from a falling planetary albedo, not the greenhouse forcing diagnostic. Albedo is down ~0.77 pp (record low ~0.284 in 2023). GSAT follows ASR at R² ≈ 0.84 versus ~0.45 for energy-imbalance. They split on story; the satellite number they both use is albedo.

In this lab. Already summarised in §11. The atlas is the place that puts both papers on one page. Same rule as this lab: the quantity that moved is the one that was measured.

Open the desk

14 — Glossary

Words this lab uses

Dotted terms in the text open a short definition on hover; click or tap one to jump here. Each entry has the textbook sense, then how this reconstruction uses it. Nothing here is a substitute for Francey 1999, Allison’s GASLAB methods, Koutsoyiannis 2024, or Cohler & Soon 2026.

46 of 46 terms

δ¹³C

Also: delta 13C · d13c · carbon-13

Textbook

The ratio of ¹³C to ¹²C in a sample, reported in per mil (‰) relative to the VPDB standard. More negative means relatively less ¹³C.

In this lab

The quantity Francey 1999 and GASLAB treated as a fossil-fuel fingerprint. This lab tracks the mixing intercept of δ¹³C vs 1/[CO₂], not just the decline.

Per mil (‰)

Also: permil · per mille · ppt

Textbook

Parts per thousand. Isotope ratios are small, so they are written as a deviation from a standard in ‰ rather than as a raw ratio.

In this lab

Industrial-era atmospheric δ¹³C falls about 1.6–2.1‰. Ice-core “corrections” are tenths of a ‰. The fossil claim jumps to −28‰ — a different scale of story.

Keeling plot

Also: keeling

Textbook

A plot of δ¹³C against 1/[CO₂]. For two-end-member mixing, points fall on a line whose intercept is the δ¹³C of the added (or removed) carbon.

In this lab

Keeling’s own diagnostic, without a second reservoir of free parameters. Four stations and the 1520–1997 proxy share an intercept near −13.2‰, not −28‰.

Mixing intercept (δI)

Also: keeling intercept · di · end member

Textbook

δI = (C₂δ₂ − C₁δ₁) / (C₂ − C₁). The isotopic signature of the net source/sink implied by two atmospheric states, or by the intercept of a Keeling plot.

In this lab

The number this lab actually measures. Observed ~−13.3‰. The fossil −28‰ is not this intercept; it is imposed later by an isoflux.

Suess effect

Also: suess

Textbook

The decline of ¹⁴C (and, by analogy, ¹³C) in air after the industrial era, attributed to adding ¹⁴C-free / ¹³C-depleted fossil carbon.

In this lab

Cited as the fossil-fuel fingerprint. A declining δ¹³C is real. Calling that decline “the” isotopic signature of coal is the claim this lab unpacks.

Isoflux

Also: isotope flux

Textbook

The product of a carbon flux and its isotopic signature. In budget inversions, land and ocean isofluxes are extra terms that close the isotope accounts.

In this lab

The term that converts an observed −13‰ intercept into a −28‰ fossil story. It is a model identity, not a flask measurement.

Firn

Also: firn air

Textbook

Compacted snow that is not yet ice. Air in the pore space still exchanges with the atmosphere until the close-off depth, typically 50–100 m.

In this lab

The join between ice and Cape Grim. Francey 1999 only made firn “agree” with Cape Grim after gravity, diffusion and a latitudinal gradient.

Ice core

Also: law dome · ice

Textbook

A cylinder of glacier ice whose trapped bubbles are a sample of old air. Age is not the same as the year of snowfall; diffusion and close-off smear it.

In this lab

Law Dome (DSS, DE08) via Rubino et al. 2019 — Allison and Francey co-authors. Ice is not air until a processing chain is applied.

Gravitational settling

Also: gravity enrichment

Textbook

Heavier molecules (¹³CO₂) settle slightly in a stagnant firn column. The enrichment is roughly proportional to depth and mass difference.

In this lab

Francey 1999 subtracts this model term so the published “atmosphere” is ice minus gravity. On the order of 0.04–0.15‰.

Firn diffusion / disequilibrium

Also: disequilibrium · trudinger

Textbook

Gases diffuse through firn. A changing atmosphere is smoothed and lagged; the bubble is not a snapshot of one year.

In this lab

A CSIRO firn-model term, larger while CO₂ is rising fast. Rubino 2013 revised the same class of model that Francey 1999 used.

Latitudinal gradient

Also: cape grim antarctica · gradient

Textbook

CO₂ and δ¹³C vary with latitude because sources and sinks are not uniform. Southern-ocean air is not Antarctic firn air.

In this lab

Francey 1999 applies ~0.08‰ so ice matches Cape Grim (41°S). The gradient is assumed, not measured in the same ice.

CG92 / CSIRO2005

Also: cg92 · csiro2005 · scale

Textbook

Successive CSIRO laboratory calibration scales for δ¹³C. Changing the scale shifts every number on that lab’s record by a constant (plus drift terms).

In this lab

Francey 1999’s modern end is CG92. Allison & Francey 2007 document the jump to CSIRO2005 (~0.025‰). A scale is not a measurement of 1900.

GASLAB

Also: allison · csiro gaslab

Textbook

CSIRO’s Global Atmosphere Sampling Laboratory: flasks of air analysed on an IRMS (MAT 252) for CO₂ mole fraction and δ¹³C.

In this lab

Allison’s Cape Grim programme is how Francey 1999 “confirms” the in-situ trend. Baseline hours are a wind-sector and CO cut, not a random sample.

Extraction blank / BFI

Also: blank · bfi · bubble-free

Textbook

Laboratory contamination or fractionation during gas extraction from ice. Bubble-free ice (BFI) is used as a process blank.

In this lab

Rubino 2013/2019: 0.025–0.07‰ — the same size as “decadal steps” Francey 1999 treated as climate.

Spline (2019)

Also: rubino · 50-year spline

Textbook

A smooth curve fitted through irregular samples. A 50-year cutoff removes high-frequency noise and, with it, some real variability.

In this lab

The Rubino et al. 2019 Law Dome annual spline — the curve Francey 1999 became. This lab reads it against HadCRUT5 and fossil GtC.

OLS

Also: ordinary least squares · regression

Textbook

Ordinary least squares: the unique line that minimises the sum of squared vertical residuals. Slope, intercept and R² follow from that fit.

In this lab

Used for Keeling intercepts and for growth ≈ a + b·T. Two-parameter OLS is a diagnostic, not a structural ocean model.

Correlation r / R²

Also: r2 · pearson · r-squared

Textbook

Pearson r is the linear association of two series (−1 to 1). R² is the fraction of variance that line explains. Both treat any two ramps as “related.”

In this lab

Levels of CO₂ vs cumulative fossil give r ≈ 0.995 because both are integrals. After stripping the ramp, residual growth vs T is 0.37 vs 0.10 for fossil.

Detrend / strip the ramp

Also: residual · ramp

Textbook

Subtract a linear (or other) trend against time so the leftover is the year-to-year wiggle, not the shared industrial-era rise.

In this lab

The test that separates two ramps from a process. Residual CO₂ growth still follows temperature; it does not follow fossil GtC.

Airborne fraction

Also: airborne fraction

Textbook

The share of emitted fossil CO₂ that remains in the atmosphere, typically quoted near 0.45. The rest is assigned to ocean and land sinks.

In this lab

A budget identity, not a measured partition of this year’s air. It is how inversions hide the rest of the fossil pulse in isofluxes.

GtC

Also: gigatonne · gt carbon

Textbook

Gigatonnes of carbon. 1 ppm of atmospheric CO₂ ≈ 2.12 GtC. Fossil numbers in the wild are often Mt of CO₂, not GtC — a factor of 3.664.

In this lab

Land ~120 GtC/yr and ocean ~80 vs ~10.5 GtC fossil this year. Human share of the gross cycle is about 5% (paper: ≤4%).

ppm

Also: mole fraction

Textbook

Parts per million by mole: micromoles of CO₂ per mole of dry air. The modern Mauna Loa unit.

In this lab

Law Dome spline plus NOAA global means. Growth rate is Δppm per year — the increment, not the integral.

Henry’s law

Also: henry · solubility

Textbook

The amount of gas dissolved in water is proportional to its partial pressure, with a coefficient that falls as temperature rises. Warmer water holds less CO₂.

In this lab

The physical reason d[CO₂]/dt can follow T: a warmer ocean and soil outgas. That is the process the two-ramps plot is not.

El Niño / ENSO

Also: el nino · nino · enso

Textbook

The El Niño–Southern Oscillation: a 2–7 year tropical Pacific swing. Warm El Niño years typically raise global temperature and terrestrial CO₂ release.

In this lab

1983, 1987, 1998, 2016, 2024 sit in observed growth and in the T-driven OLS. A fossil-GtC fit is a smooth ramp and cannot make those spikes.

HadCRUT5

Also: hadcrut · gistemp · temperature

Textbook

The Met Office / CRU global surface-temperature anomaly, 1850–present. GISTEMP is NASA’s related series from 1880.

In this lab

The T in T → CO₂. NOAA growth vs HadCRUT5 is r = 0.83; vs fossil GtC, 0.79. After detrending, only T still organises the wiggles.

Biosphere / photosynthetic discrimination

Also: photosynthesis · c3 · respiration

Textbook

Plants prefer ¹²CO₂, so organic carbon (and coal, oil, gas made from it) is ¹³C-depleted, typically −20 to −30‰ for C3 biomass. Respiration returns that signature.

In this lab

Seasonal Keeling loops reach ~−25‰ and stay there as fossil emissions triple. The net annual intercept does not walk toward the fuel mix.

Fossil δ¹³C (≈ −28‰)

Also: minus 28 · andres · fuel mix

Textbook

Coal, oil and gas inherit plant depletion plus further processing. Inventory-weighted fossil CO₂ is often quoted near −28‰ (Andres / CDIAC / IPCC).

In this lab

The claimed fingerprint. It is not the intercept of the flasks or the ice. A genuine fossil takeover would drag δI toward −28‰ as the gas share rose.

Flask sample

Also: flasks · baseline

Textbook

Air collected in a glass flask at a station, later analysed in a laboratory. Selection rules decide which flasks represent “background” air.

In this lab

Cape Grim baseline: 190–280° wind off the Southern Ocean, low CO, then an IRMS cut. Retained vs rejected is a protocol, not a random draw.

In situ

Also: insitu · continuous

Textbook

Measured on site by a continuous analyser, as opposed to discrete flasks shipped to a lab.

In this lab

Cape Grim and Mauna Loa in-situ CO₂ lock the modern mole-fraction end. Allison & Francey 2007 discuss flask–in situ offsets of the size that “resolve” mismatches.

Gross vs net flux

Also: gross flux · net flux

Textbook

Gross fluxes are the large two-way exchanges (photosynthesis and respiration, ocean invasion and evasion). Net is the small residual that changes the atmosphere.

In this lab

Fossil carbon is a few percent of the gross cycle. Koutsoyiannis: human ≤4% of the total; T-driven natural [CO₂] changes exceed fossil by more than 3× over 65 years.

Carbon inversion

Also: inverse · budget inversion

Textbook

A model that infers sources and sinks from observed concentrations (and isotopes), given transport and prior fluxes. Under-determined: extra terms are free.

In this lab

Where the isoflux lives. The inversion can always blame −13‰ air on −28‰ fuel if land/ocean isofluxes are allowed to do the arithmetic.

Two-ramps trap

Also: two ramps · spurious correlation

Textbook

Any two series that both rise (or both integrate a positive quantity) are highly correlated. Correlation of levels is not a test of who causes whom.

In this lab

[CO₂] vs T is r = 0.95; [CO₂] vs cumulative fossil is 0.995. That line is the misunderstanding. The process test is the increment, then the residual.

Growth rate (increment)

Also: dco2 · annual increment

Textbook

The year-to-year change in atmospheric CO₂, in ppm/yr. Distinct from the concentration itself, which is the integral of past increments.

In this lab

The diagnostic Koutsoyiannis’s causality papers use. NOAA global increment vs T beats vs fossil; El Niño spikes follow the T-driven OLS.

Cape Grim

Also: cgo · baseline station

Textbook

A clean-air station on the northwest tip of Tasmania (41°S), sampling Southern Ocean baseline when the wind is in sector.

In this lab

The modern end Francey 1999 tied the ice to. CG92, GASLAB flasks, and the in-situ record all meet here — after the flags.

Keeling curve

Also: mauna loa curve · co2 record

Textbook

The continuous record of atmospheric CO₂ at Mauna Loa started by C.D. Keeling in 1958. Publications usually show a deseasonalized smooth; the monthly (and weekly) air is a sawtooth.

In this lab

Zoom the raw months and the 6–8 ppm seasonal bite is the biosphere, larger than a year’s fossil increment. The ribbon is not a fossil staircase.

Residence / turnover time

Also: turnover · lifetime · e-folding

Textbook

The mean time a CO₂ molecule spends in the air before it is exchanged into ocean or land. IPCC AR4: about 4 years. Distinct from the ‘adjustment time’ of a concentration perturbation.

In this lab

Bomb-¹⁴C and mass-balance (Essenhigh 2009, Starr 1993) put the same quantity in the 5–10 year band. That is a short cycle, not a century hangover.

Adjustment time

Also: perturbation lifetime · revelle

Textbook

How long a *concentration* anomaly takes to decay after emissions stop, given the Revelle buffer in the ocean. IPCC quotes decades to centuries. It is a model of the leftover, not a measurement of the sawtooth.

In this lab

The quantity often quoted as ‘CO₂ lasts 100 years.’ It is not the Keeling curve, and it is not the bomb-¹⁴C pulse.

Bomb ¹⁴C pulse

Also: bomb radiocarbon · delta 14c

Textbook

Thermonuclear tests (peak 1962–63) doubled atmospheric ¹⁴C. After the test ban the excess ¹⁴CO₂ declined as it mixed into ocean and biosphere — a dated pulse of CO₂ leaving the air.

In this lab

Hua et al. 2013 / Levin: tropospheric e-folding of order 10 years. An empirical 5–10 year cycle for carbon atoms, not a spline.

Seasonal CO₂ cycle

Also: sawtooth · seasonal amplitude

Textbook

Land photosynthesis draws CO₂ down in NH summer; respiration returns it in winter. Mauna Loa peak-to-trough is about 6–8 ppm each year.

In this lab

That bite is ~14 GtC exchanged seasonally — more than a year of fossil. Zoom the Keeling curve and that is what you actually see.

CERES

Also: ceres ebaF · nasa ceres

Textbook

NASA’s Clouds and the Earth’s Radiant Energy System: satellite radiometers that measure reflected shortwave and outgoing longwave at the top of the atmosphere, from 2000 to present.

In this lab

The 26-year record both Nikolov & Zeller and Goessling, Rackow & Jung read. It is where the albedo drop is measured, not modelled.

Bond albedo

Also: planetary albedo · albedo

Textbook

The fraction of incoming solar radiation a planet reflects to space, after all cloud and surface interactions. Earth’s mean is about 0.29.

In this lab

CERES 2023 is the satellite floor (atlas: α ≈ 0.284). The last 26 years of warming track this darkening, not a greenhouse ΔF.

ASR (absorbed shortwave)

Also: absorbed solar · absorbed sunlight

Textbook

Incoming solar minus reflected shortwave: the sunlight the planet actually keeps. ASR = ISR × (1 − albedo).

In this lab

The quantity Equation 16 uses. Atlas: ASR vs GSAT R² 0.84 over CERES. Goessling 2023: +1.82 W m⁻² vs 2001–2022.

EEI (energy imbalance)

Also: toa imbalance · net flux

Textbook

Net flux at the top of the atmosphere: ASR minus outgoing longwave. IPCC treats a positive EEI as heat going into the ocean.

In this lab

Tracks GSAT worse than ASR (R² 0.45 vs 0.84). Nikolov & Zeller: the leftover after adiabatic attenuation of longwave, not the cause.

Radiative forcing (ΔF)

Also: forcing · delta F · ghg forcing

Textbook

An imposed change in net TOA flux, usually from greenhouse gases, before the surface temperature has adjusted. The IPCC control knob.

In this lab

The term Equation 16 does not have. Goessling still book most of 2023 as anthropogenic forcing; the atlas’s overlap with them is albedo, not this lab.

Two-endmember mixing

Also: two end member · binary mix · mixture equation

Textbook

A mixture of two sources with signatures δA and δB in fractions f and 1−f has signature f·δA + (1−f)·δB. Solving for f is unique once the mix and both endmembers are known.

In this lab

Cohler & Soon apply this to the Keeling intercept: δI = f·δF + (1−f)·δN. With δI = −13.2‰ and δF = −28‰, f cannot be large unless δN is unphysical.

Fossil fraction f

Also: f · fossil share of Fnet

Textbook

The share of a net flux that comes from fossil carbon. Distinct from airborne fraction (a budget leftover) and from the fossil share of the whole atmospheric burden.

In this lab

In Cohler & Soon, f is the fossil share of Fnet — the net addition the intercept sees. Instrumental bound [0, 0.26]; five-century constancy collapses to ≈0.013.

Sclerosponge

Also: ceratoporella · coralline sponge · böhm

Textbook

A slow-growing calcareous sponge whose aragonite skeleton records the δ¹³C of surrounding seawater DIC, with a small stable fractionation and annual banding that can be dated.

In this lab

Böhm et al. 2002, Caribbean Ceratoporella nicholsoni, ~1500–present. The paper’s 500-year constancy of δI. This lab’s Böhm series is a labelled reconstruction, not a digitised table.